Team leads
A weekly check on hours and activity
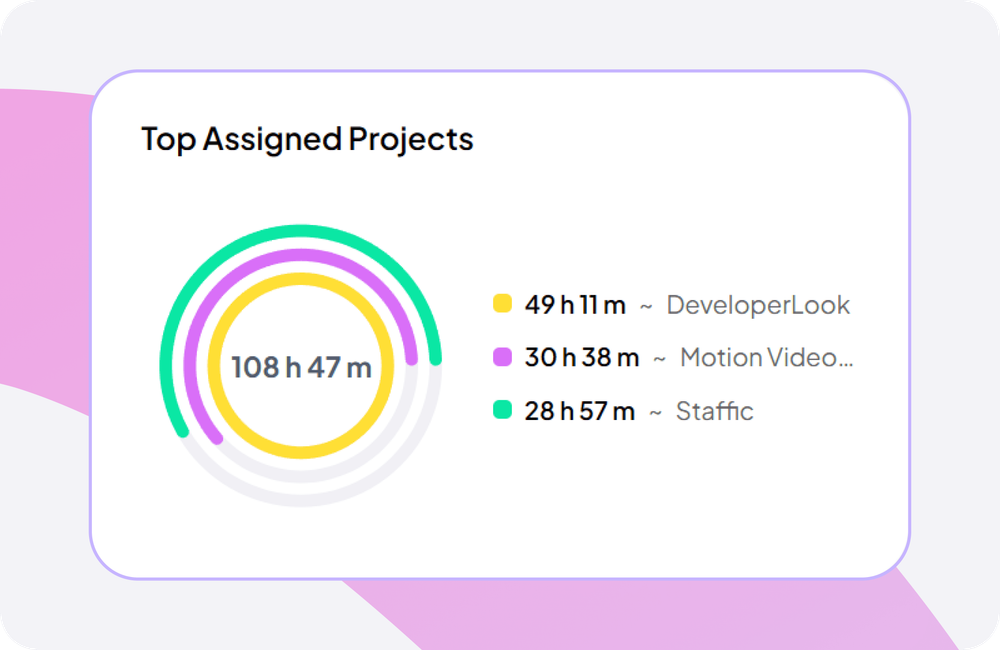
Run the Time and Activity report for last week, then keep an eye on this week's hours and top projects on the dashboard.

Features
All 33 featuresSee the work while it happens.
 DashboardYour team's week at a glance, Monday to Sunday
 Live FeedEliteSee who's tracking time right now, and on what
 ScreenshotsStandardVisual proof of work, captured automatically
 AppsWhich apps each tracked session used
 URLsThe websites behind the tracked time
 Screen RecordingsEliteFull session video, beyond a screenshot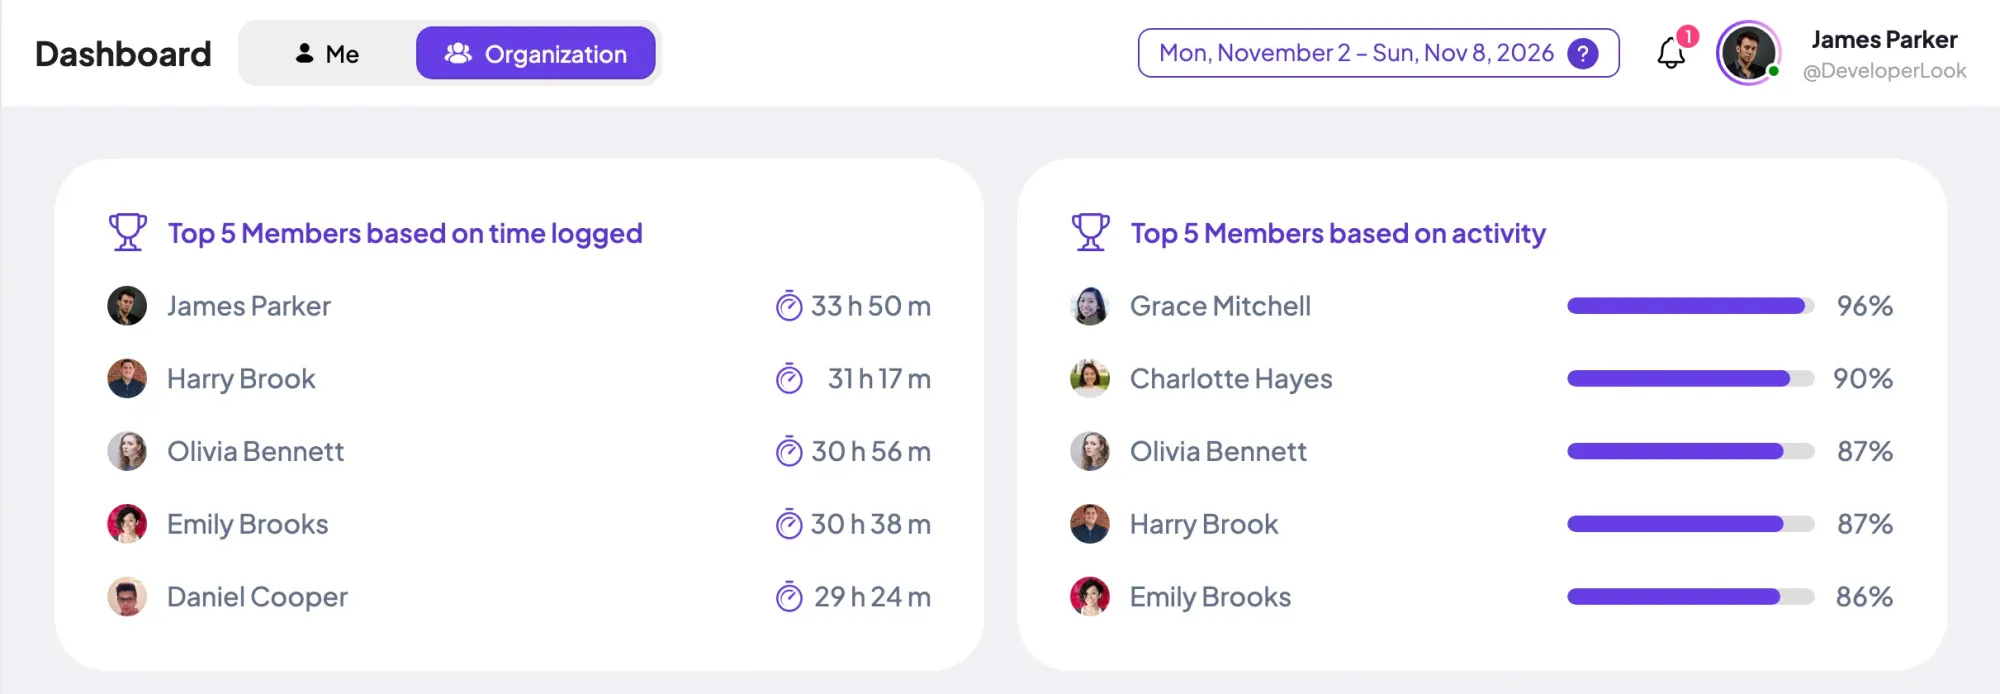
01 / 33
Dashboard
The team dashboard: this week's hours, today's performance, top members, ongoing tasks, top projects and the most used apps and websites.
View DashboardWorkforce Analytics
Staffic is workforce analytics software for teams that track their time in its desktop app. The dashboard, the reports and Staffic AI read the same hours, activity levels, apps and URLs, so you see how the week went without chasing status updates. The dashboard and the MCP server work on every plan, including Free.
In short
Staffic Workforce Analytics is the workforce analytics platform built on the time members track in the desktop app. The dashboard shows the week's hours, projects, apps and websites on every plan. Standard adds the Time and Activity, Apps and URLs usage and Performance reports, and Elite adds activity rankings and Staffic AI. The MCP server lets your own AI tools read the same data.
How it works
Analytics in Staffic needs no extra setup: once your team tracks time, the numbers are there.
Workforce analytics software
Every chart and report below starts from the sessions members track in the desktop app.
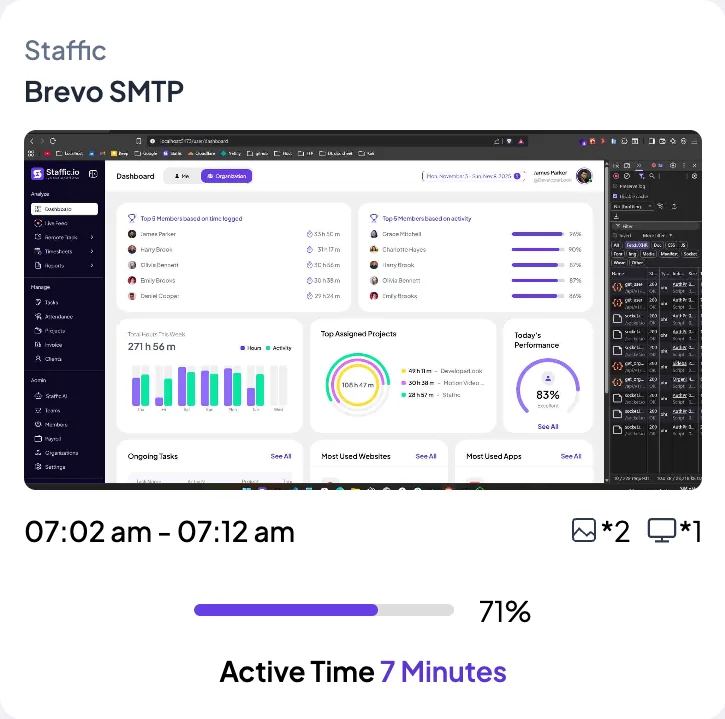
Each session carries its project, task, activity level, apps and URLs. Staffic adds them up by member, project and day in your organization's time zone, so the dashboard, the reports and Staffic AI give the same numbers.
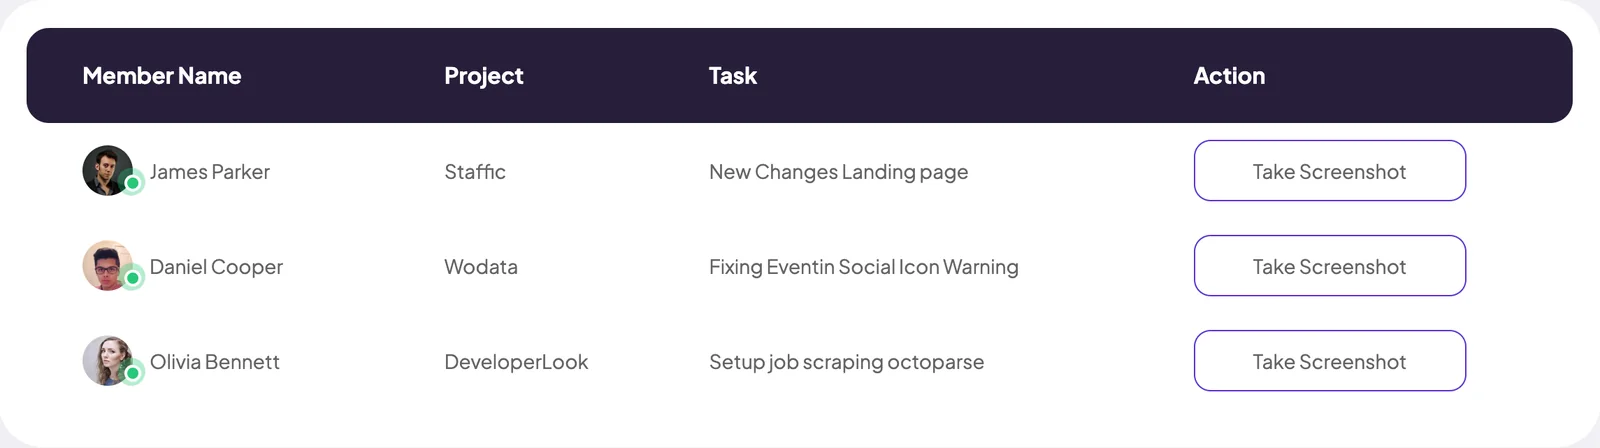
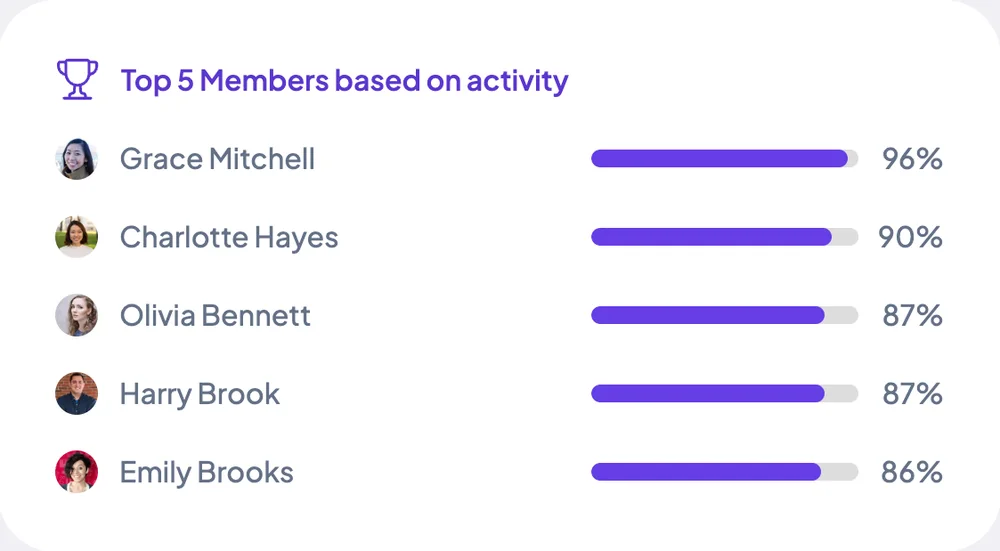
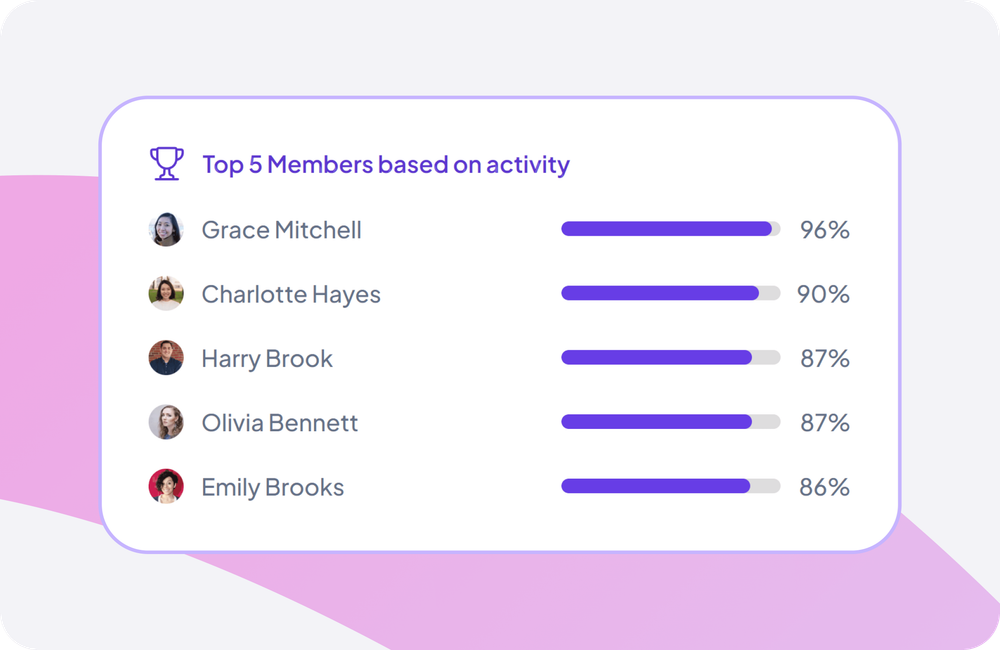
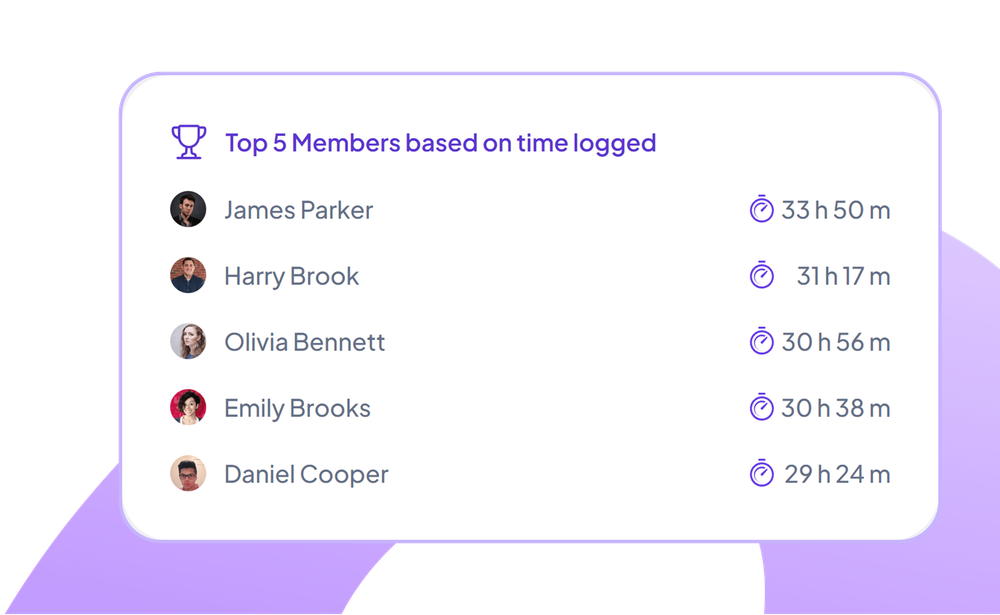
The dashboard's Organization view shows the week's total hours with hours per day, the top assigned projects, and the most used apps and websites. Standard ranks the top 5 members by time logged, and Elite adds activity rankings and today's activity gauge.
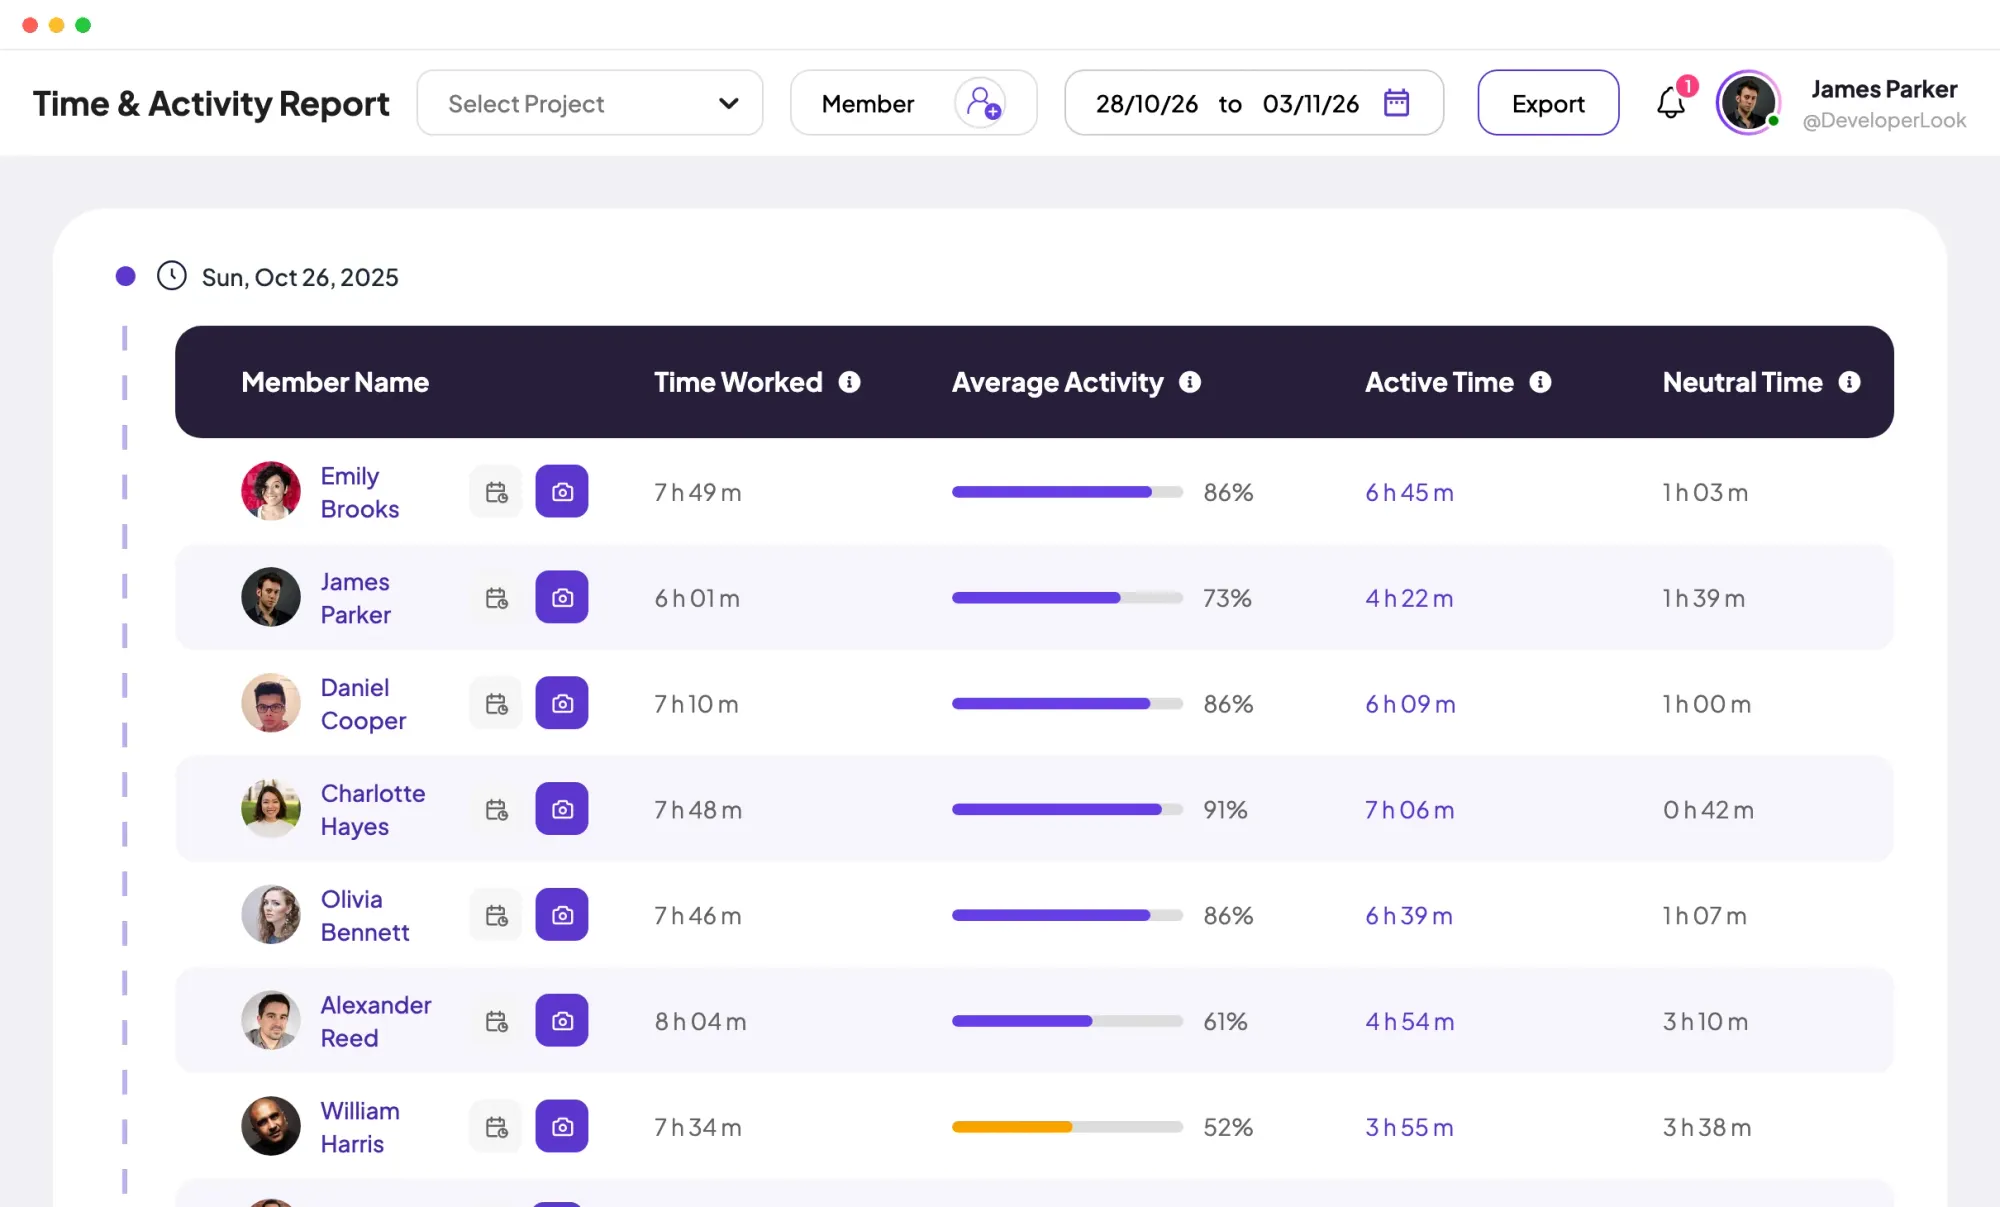
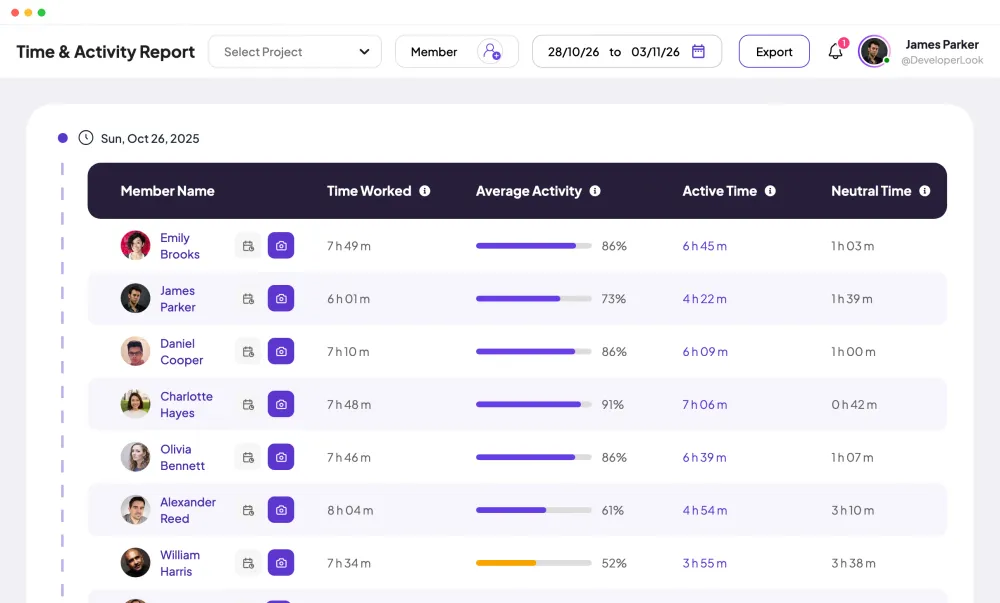
Pick any date range and the report gives each member's time worked, average activity, active time and neutral time side by side. Narrow it to one project or a few members, then export the table to Excel or PDF.
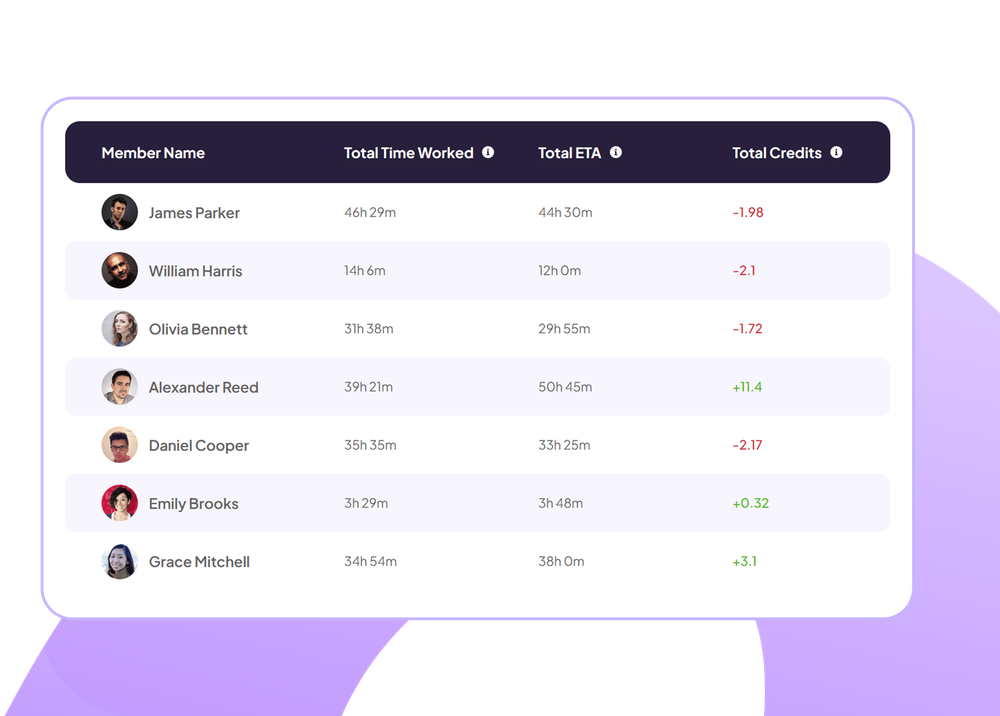
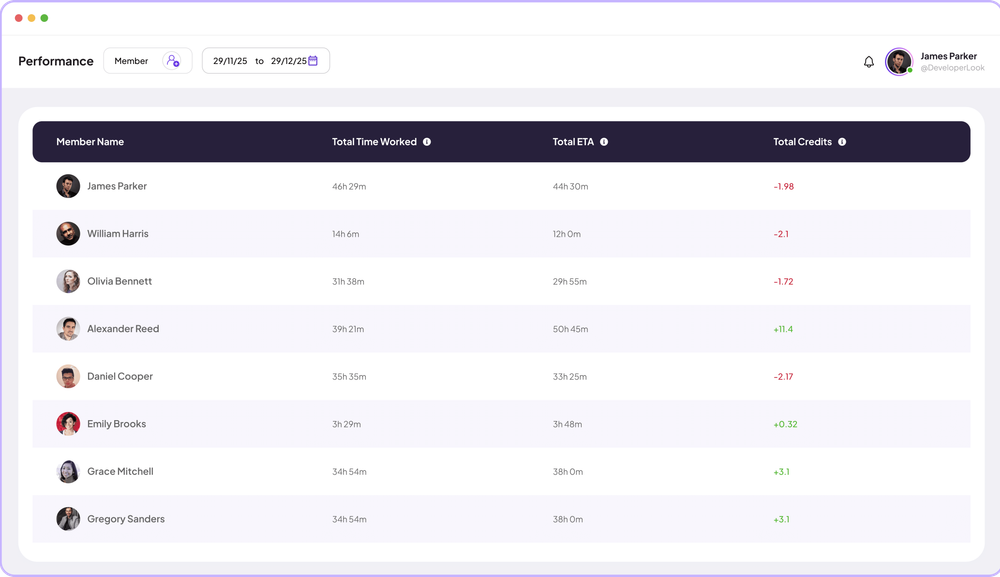
Performance compares the time each member worked with the estimated time (ETA) of their tasks. Total Credits is the estimate minus the time worked, in hours: green when the work came in under the estimate, red when it ran over.
The Apps and URLs usage report shows the apps and websites each member used per day, with the total time. Switch between apps, URLs or both, and filter by member and date range to see where tracked time went.
Staffic AI answers questions like "How many hours did I work today?" or "What apps have I used today?" from your organization's own data. It reads work time, activity, idle time, clock-ins, tasks, projects and apps, and it can summarize a workday.
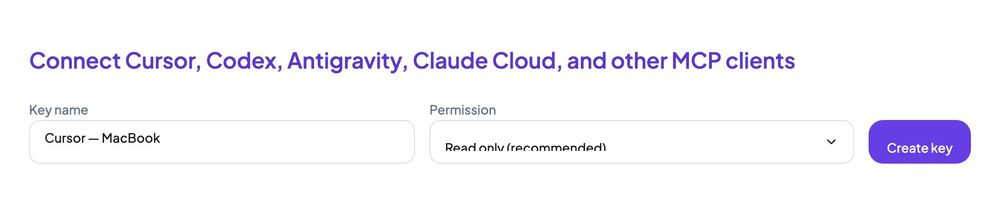
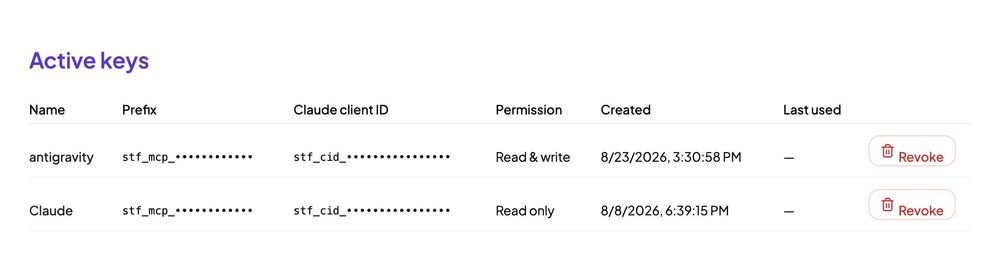
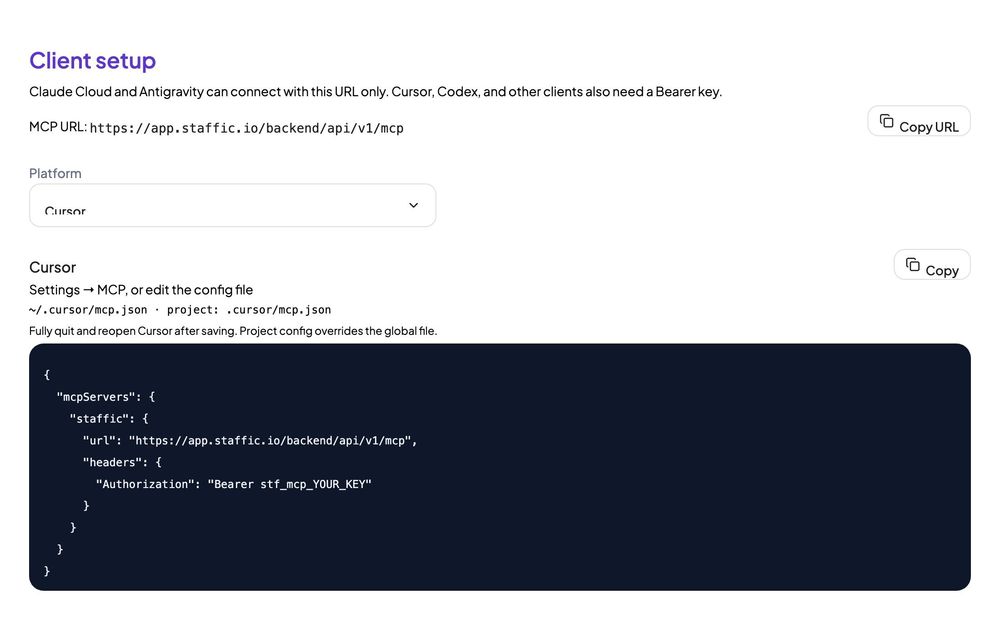
The MCP server connects Claude, Cursor, Codex and other MCP clients to your organization. An admin creates a read-only or read and write key, and the AI tool can then read timesheets, attendance, activity reports and performance.
Showing From tracked sessions to answers.
Control and privacy
Staffic analyzes only what the desktop app records while the timer runs, and you decide who can read it.
Set it up
Five steps from sign-up to your first report. The dashboard and the MCP server work on Free; the reports need Standard or Elite.
Sign up and set your organization's time zone, which the reports use to split each day.
Start freeAdmin › OrganizationsTurn app, URL, keyboard and mouse tracking on or off for your organization.
Settings › ActivityLet the roles that need reports open them, or keep them for admins.
Settings › Access ControlOnce your team has tracked a few sessions, the dashboard fills in and each report shows the dates you pick.
Reports › Time & ActivityCreate a key, then copy the setup for Claude, Cursor, Codex or another MCP client.
Settings › MCP / Coding agents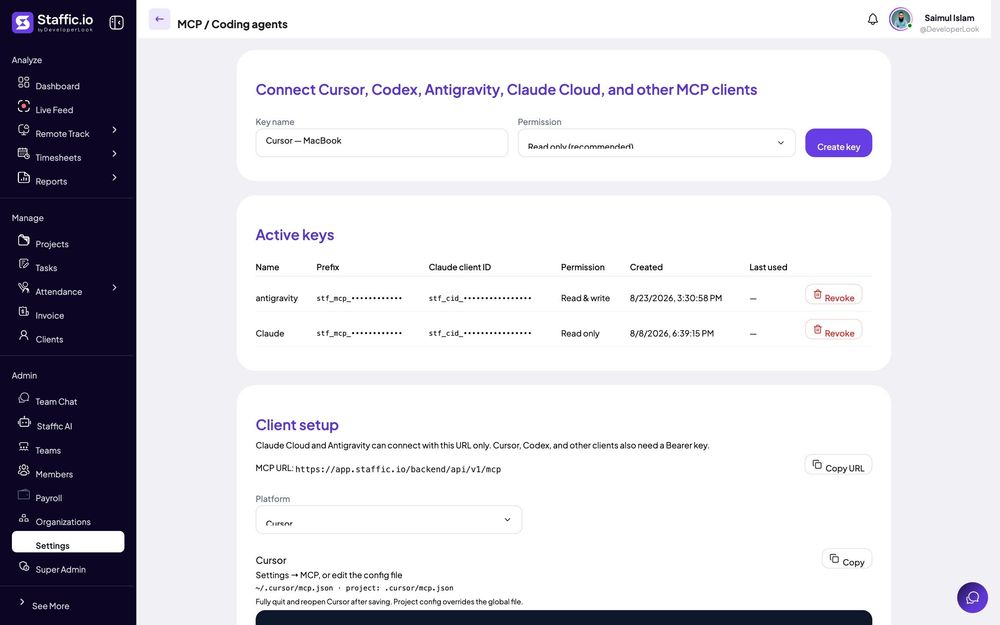
Compare
The dashboard, the reports and Staffic AI read the same tracked time. Pick the one that fits what you need to know.
Swipe the table to compare
| Compare | Dashboard | Time & Activity | Performance | Staffic AI |
|---|---|---|---|---|
| Best for | The week at a glance | Hours and activity for any dates | Work against task estimates | One quick question |
| Plan | Every plan; rankings on Standard and Elite | Standard and Elite | Standard and Elite | Elite |
| Time span | This week and today | Any date range | Any date range | What you ask about |
| Filters | Organization or Me view | Project, members and dates | Members and dates | Your own data by default |
| Output | Charts and rankings | Table with Excel or PDF export | Table with credits per member | An answer in the chat |
| Link | Dashboard | Time & Activity | Performance | Staffic AI |
Plans follow what the Staffic app enforces today.
Specs and terms
The facts behind the feature, and what each number on the Workforce Analytics page means.
Who it’s for
Team leads, project managers and technical teams read the same data in different ways.
Run the Time and Activity report for last week, then keep an eye on this week's hours and top projects on the dashboard.
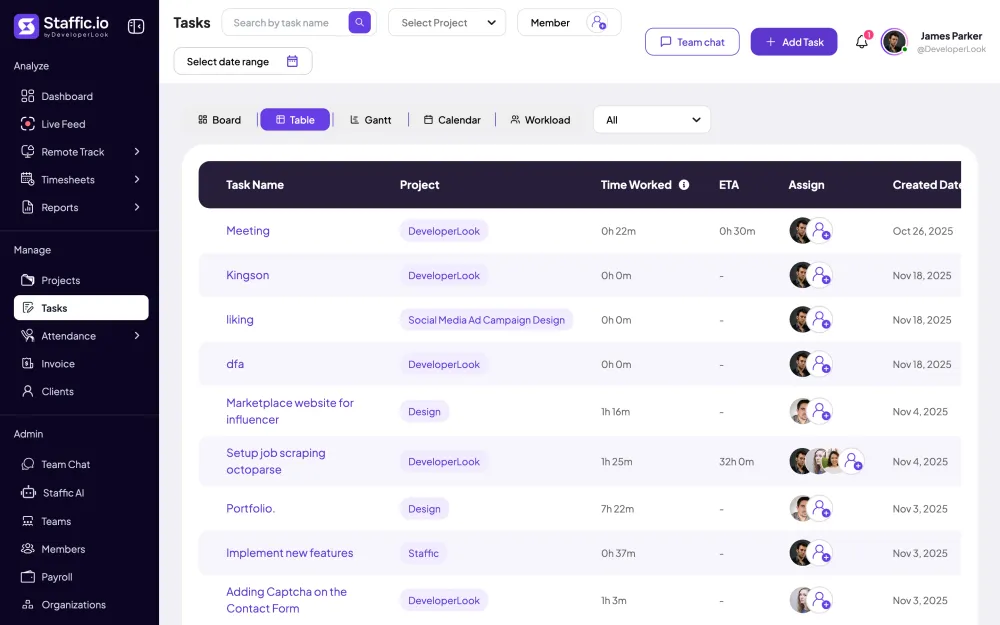
Filter the Time and Activity report by project to see who worked on it, for how long and how actively, then compare task estimates in the Performance report.
Connect Claude, Cursor or Codex through the MCP server and ask about timesheets or attendance without opening another app.
Customer stories
Stop juggling tools. Staffic gives your team time tracking, projects, payroll and performance analytics in one platform.
Try Staffic for free“Staffic.io brings transparency without micromanagement. Our team feels trusted, and productivity has never been higher.”
Pricing
Workforce Analytics is included on every plan, Free included. You pay per active user only when your team grows past 3 members.
Compare every planPrices in USD per active user. Billed monthly, Standard is $7.50 and Elite is $9.80 per user.
Workforce analytics software turns data about how your team works into reports you can act on: hours, activity, time against estimates and the tools people use. Staffic builds it from sessions members track in its desktop app, so every chart reads the same record. If you're comparing affordable workforce analytics tools, Staffic's dashboard and MCP server are on the Free plan for up to 3 members.
Time worked, activity level and time against estimates matter most, because together they show how much work happened and how it went. For remote teams, add neutral time and the apps and websites used, which tell you what you'd otherwise see in an office. Staffic's workforce productivity analytics tools, the reports on Standard and Elite, show each of these per member.
Time tracking records the hours; workforce analytics reads them across people, projects and weeks. In Staffic, the desktop timer does the tracking on every plan, and the dashboard and reports turn those sessions into totals, rankings and comparisons with task estimates. When you look for the best workforce analytics software, check that it reads data your team already records.
By project, yes, and by team or client through their projects. The Time and Activity report filters by project and member, and the dashboard ranks your top assigned projects. Teams group members and projects on Standard and Elite, and on Elite each project can be linked to a client, so you read client time project by project.
Compare the hours your team works with the hours their tasks were estimated at. Staffic's Performance report shows time worked, total ETA and credits per member, and weekly timesheets show who is close to their usual hours. Use those numbers to see who has room before you assign the next project.
Record only what you need and limit who can read it. Staffic records nothing while a member's timer is off, lets admins turn app, URL, keyboard and mouse tracking on or off, and stores activity as a percentage rather than the keys typed. Reports open only for admins and the roles you grant in Access Control, and members see their own numbers.
Yes, on Standard and Elite. The Time and Activity and Manual Time reports export to Excel or PDF, and Clock In/Out exports to PDF or Excel. You can also connect an AI tool through the MCP server to read timesheets and reports from your organization.
Every plan includes Workforce Analytics. Free covers up to 3 members. Standard is $5.50 per user per month billed yearly ($1.00 during the current offer, until September 12, 2027) or $7.50 billed monthly, and Elite is $5.80 per user per month billed yearly or $9.80 billed monthly.
Explore more
The team dashboard: this week's hours, today's performance, top members, ongoing tasks, top projects and the most used apps and websites.
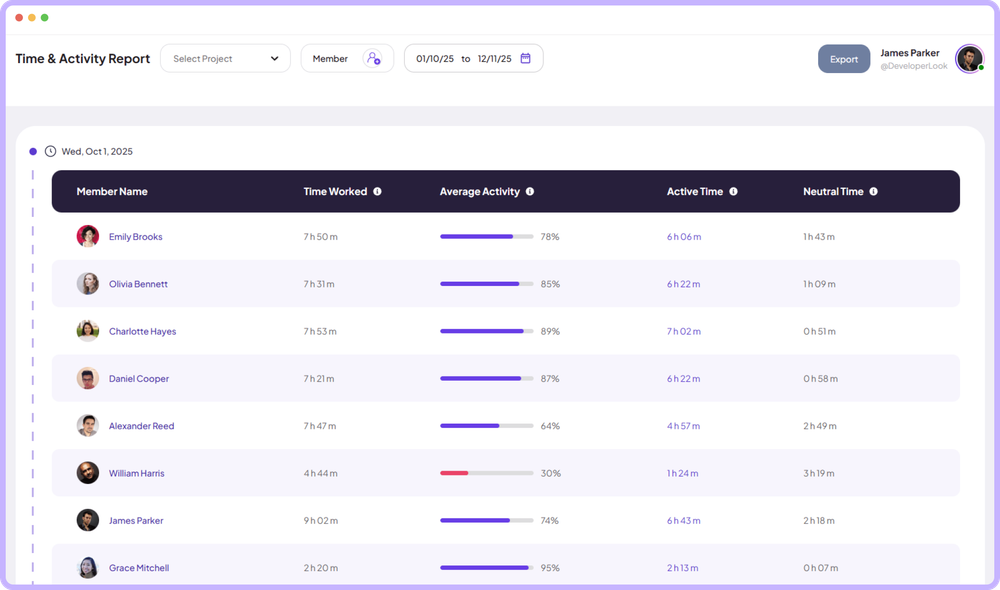

The Time & Activity Report shows each member's time worked, average activity, active time and neutral time for every day you pick.

Performance compares each member's time worked with the estimates on their completed tasks, so you see who runs over and who has room.
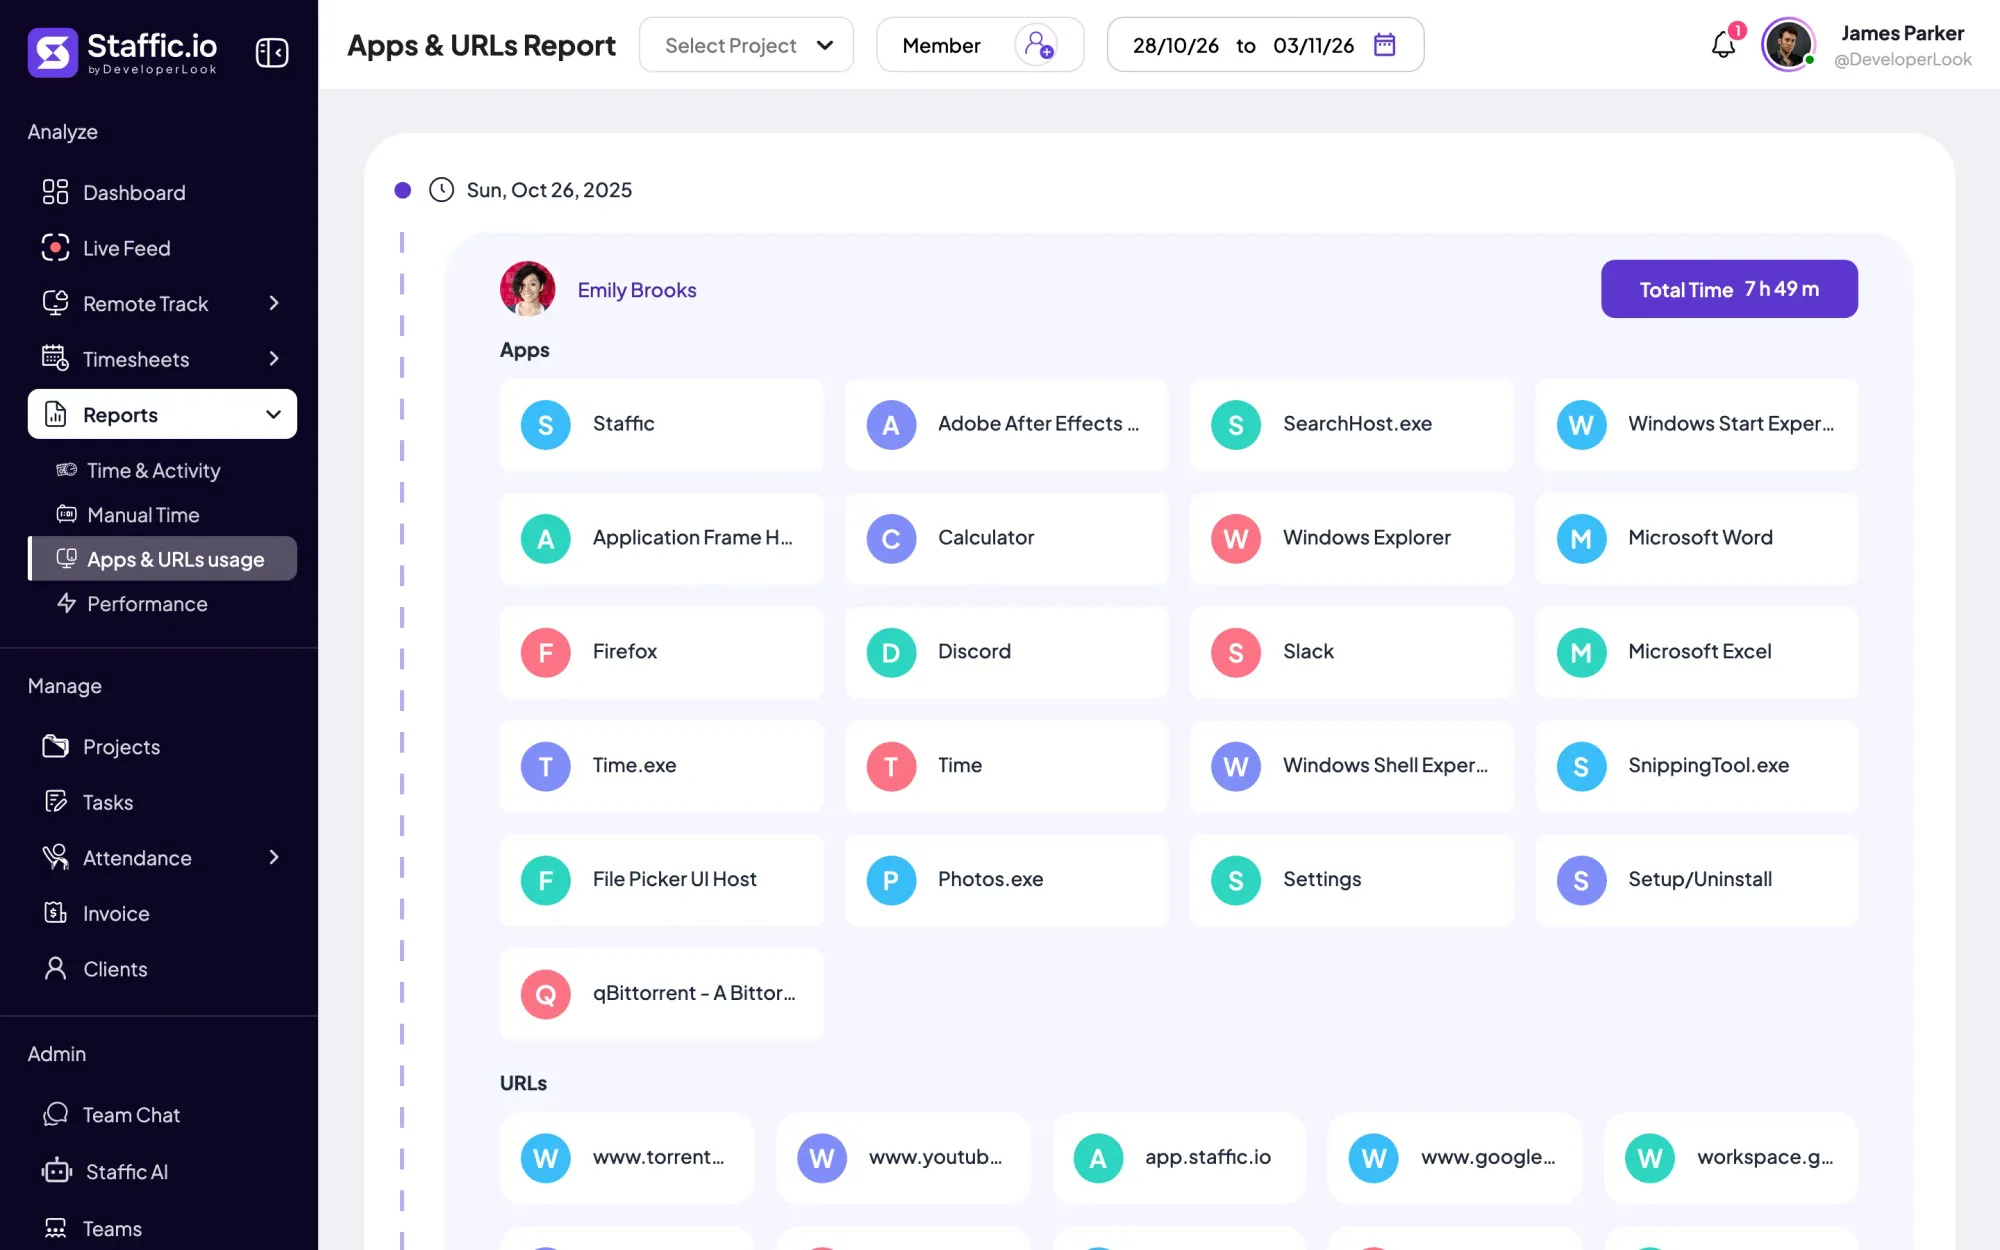

Employee internet monitoring in one report: the apps and websites each member used per day of tracked time, with total time. Standard and Elite.
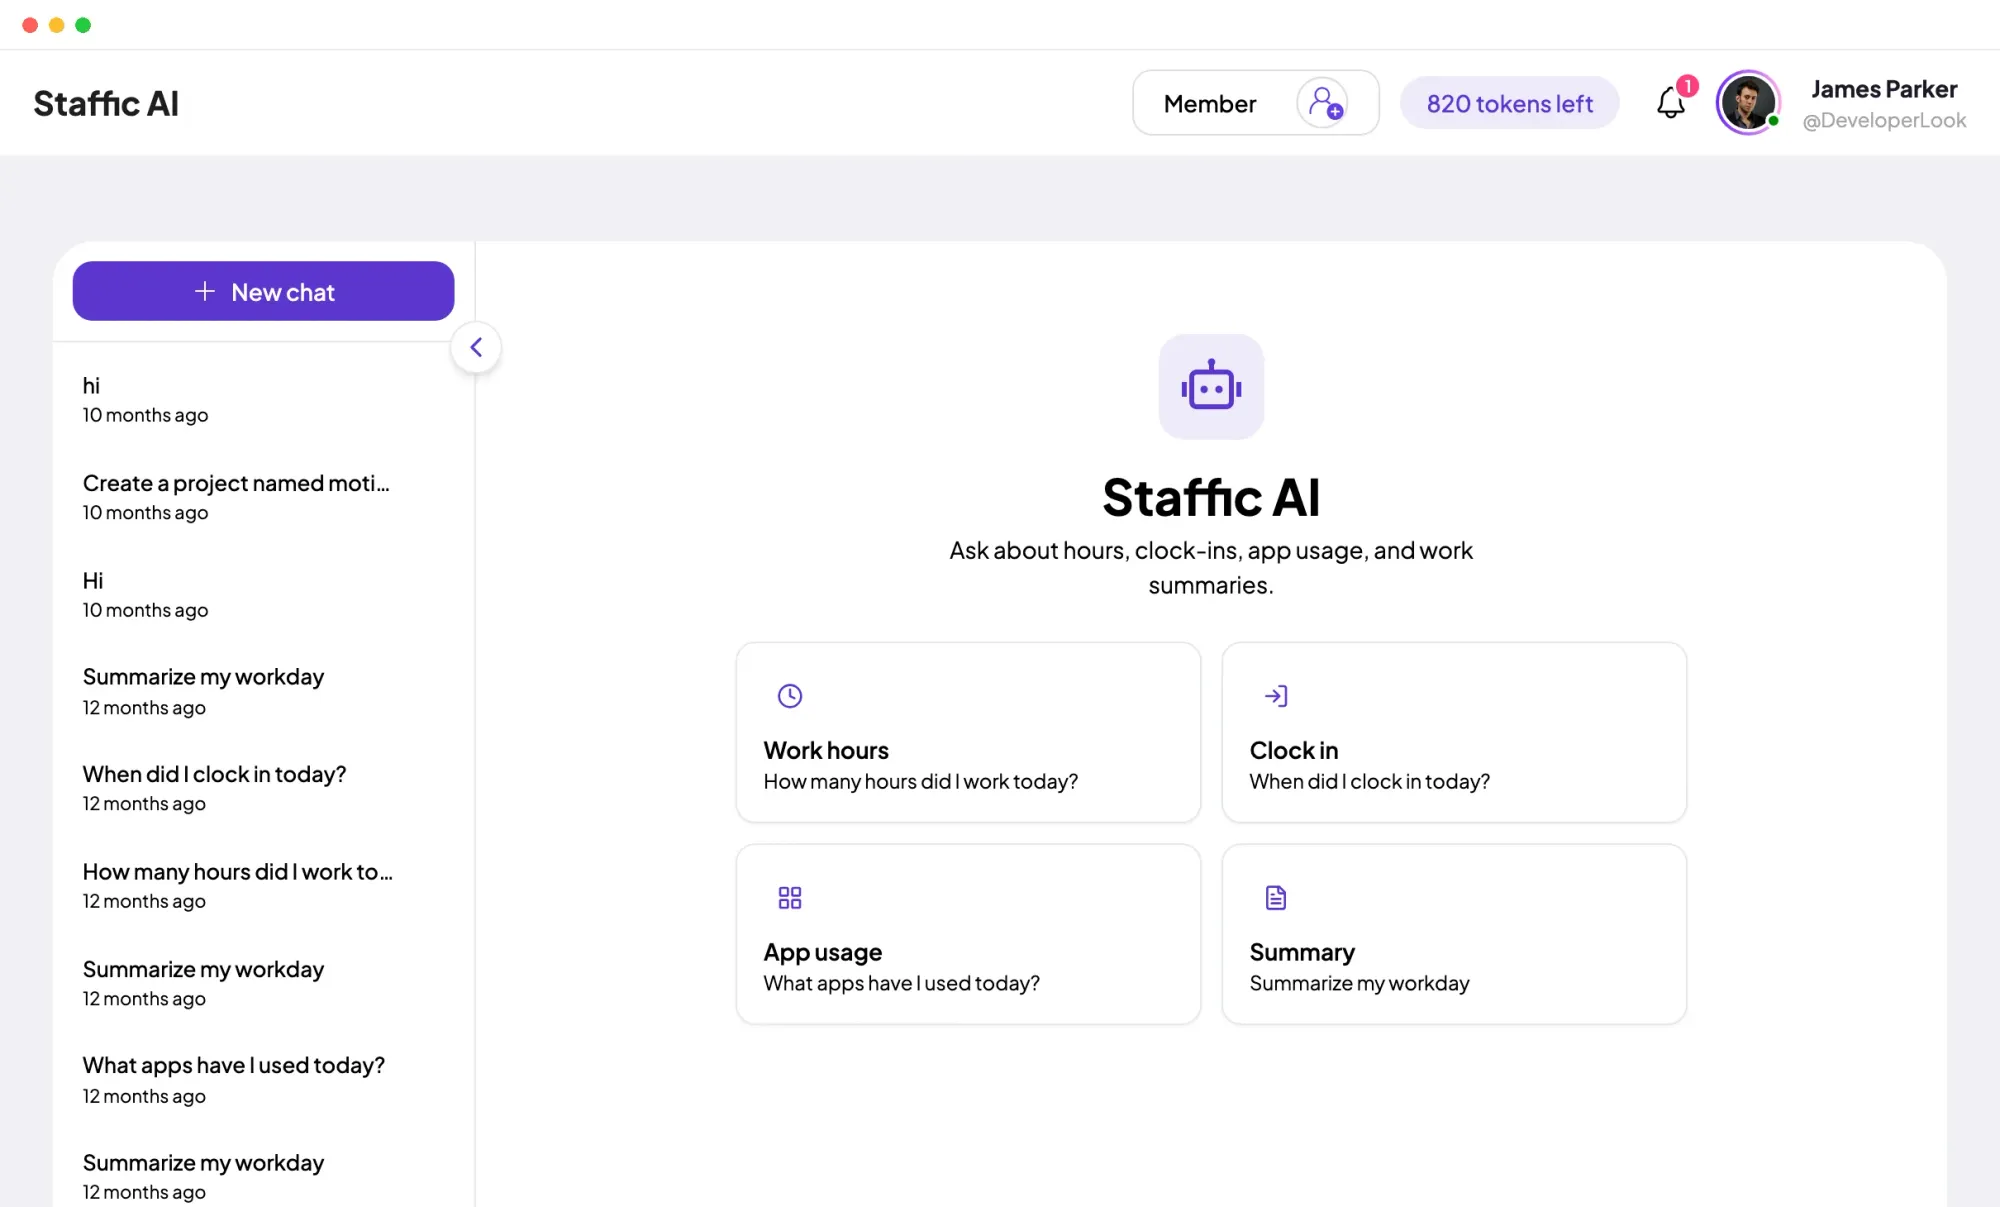

Staffic AI answers questions about hours, clock-ins, app usage and workday summaries in plain English, from your team's tracked data.

The built-in MCP server lets Claude, Cursor, Codex and other MCP clients read and update your Staffic data with a key you control.
Free for up to 3 members
Create your workspace, invite your team, and the first timesheet builds itself.