How to Use the Performance Report
Compare team members on time worked, estimated time allocation (ETA), and credits for the period you select — use with clear policy and after timesheet approval.
Performance
Open the report
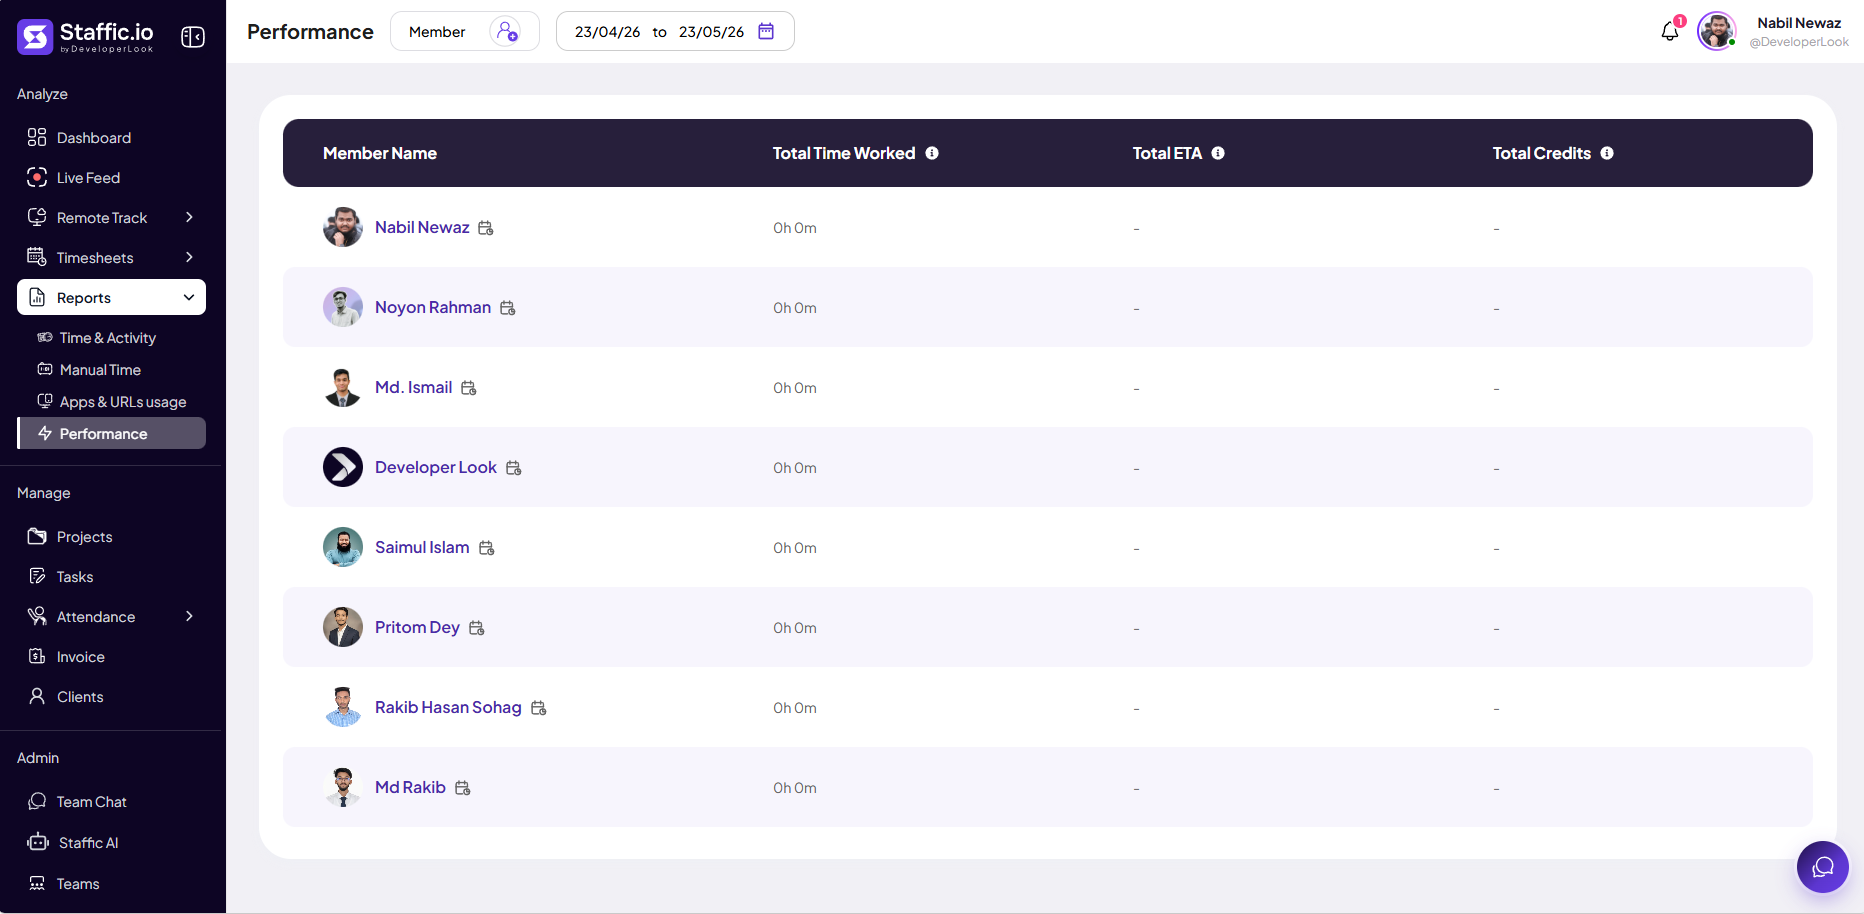
Go to Reports → Performance under Analyze in the left sidebar. Use the Member filter and date range picker at the top to set who and which period you are reviewing.
Team rankings and advanced activity analytics may require Standard or Elite — see Pricing. Related views such as Performer Analysis and Leaderboard are on the Reports hub on eligible plans.
Read the table
The main view is a comparison table — one row per member in scope. Hover the i icons on column headers for definitions of each metric.
Member Name
Profile, name, and a link icon to drill into that member’s detail where your role allows.
Total Time Worked
Sum of tracked hours in the selected date range — same family of data as Timesheets and Time & Activity.
Total ETA
Estimated time allocation for the period when your organization uses ETA on projects or tasks. Shows a dash when ETA is not configured or does not apply.
Total Credits
Credits earned or assigned in the period when your plan uses the credits feature. Shows a dash when credits are not in use.
If every row shows 0h 0m or dashes, widen the date range, confirm members tracked time in that period, and check that ETA/credits are enabled in your workspace.
What you see
Use Performance to compare contributors side by side before reviews or capacity planning. Sort mentally by Total Time Worked for workload; use ETA and Credits when your process ties estimates or incentives to tracked output.
Capacity check
Who logged the most hours — useful for staffing, not as the only measure of value delivered.
Estimate vs actual
When ETA is populated, compare it to time worked to spot over- or under-estimated work.
Responsible use
Only use Performance after Timesheet Approval when hours feed reviews or bonuses. Share with the team how scores are calculated and what they are not (they do not measure code quality, sales closed, or client satisfaction by themselves).
Pair with Work Notes, project outcomes, and manager check-ins. Performer Analysis and Leaderboard on the Reports hub offer related views on eligible plans.
Tips
- Never use rankings as the sole input for termination or compensation — document a broader review process.
- Filter by team or project so designers are not compared directly to sales on the same chart.
- Re-run the report after rejected timesheets are fixed so rankings reflect approved data.
Ready to get started?
Create your organization, invite your team, and start tracking in minutes.
Start Free Trial